Take Another Bite Out Of The Apple?

The much awaited Apple Inc. (AAPL) earnings report is finally in and it has beaten most of the analyst expectations as was widely predicted. The problem is that Wall Street has been rather skeptical on the revenues last quarter and this has seen the shares tumble. Yet, most of the people I know had decided to purchase an Apple product during their holiday shopping and it showed in the $54.5B quarterly revenue that was reported in the recent earnings release. However, it simply wasn't enough.
Nonetheless, Apple looks great fundamentally and it is sitting on a ton of cash with little-known cash-generating ventures such as the hedge fund Braeburn Capital being partly responsible for the perpetually growing cash pile. I know it is one of the most overanalyzed stocks out there, but let's go ahead and have a shot at scrutinizing it one more time.
Valuation
There were three trailing valuation metrics that I used to decipher how much Apple stock was really worth. These were the P/E, P/B and P/S ratios and they all pointed to the Cupertino, CA based tech giant trading dirt cheap even at the current stock price of $439.88 a share.
For instance, the current P/E of 9.98 is much lower than the average over the last five years which was 17.8. During this five-year period, the high was 37.9 and the low was 8. The P/B of 3.25 is also lower than the 5-Year average of 4.10. During the last five years, the high value was 6 and the low value was 3.03.
When sizing up this stock using ratios, it is quite apparent that we are not paying too much for Apple and even the Price/Sales (P/S) ratio tells the same story. The current P/S is 2.508 and this is below the 5-Year average of 3.471. The year 2008 saw a lot of volatility in the P/S ratio with a maximum value of 4.705 being reached prior to the financial crisis and then a minimum value of 1.908 being reported in December 2008.
The Post Steve Jobs Era
I am always looking at great companies to invest in that also have great management teams. And the CEO is vital. One look at Tim Cook and you could almost mistake him for the late Apple co-founder Steve Jobs. However, the two have their different leadership styles, with Cook already making some questionable decisions like the use of celebrities to endorse Apple products - something Jobs steered clear off.
It's been just over a year since Cook took over the reins from Jobs and he's already been exposed with the Apple maps snafu being one and the hiring of the short-lived Apple retail chief Jon Browett being another. At the same time, there have been several positives during Cook's time as Apple CEO with his aggressive lawsuits being a success - the "Samsung Patent Trial", for instance - and his empathy with employees is also widely noted as a good thing. Still, this empathy can be a drawback as suppliers are not as afraid of Cook as they were of Jobs. This was evident in the way information about the iPhone 5 was leaked prior to its release leaving nothing to the consumer's imagination.
Price Target
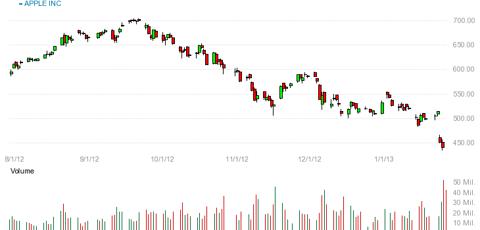
Apple has tanked considerably since its December quarter earnings report came out as trading on the NYSE closed Wednesday and this has impacted its consensus price target which has fallen to $670 from $745 just hours prior to the earnings release. Even so, there is still considerable upside of 52.27% and this confirms that Apple is very much undervalued.
Price targets have been slashed, but this occurs a lot when stock prices decline sharply because analysts want to look less silly. For example, Deutsche Bank (DB) cut its price target almost 28% from $800 a share to $575.
Forward Valuation
Analysts forecast that Apple will earn $12.00 a share for the fiscal year 2012. That would make for a forward P/E multiple of 36.6. It then appears that AAPL is much cheaper than other large cap tech stocks. There is no other stock for close comparison with AAPL, but it would help us assess better if we compare with the forward P/E multiples of other large cap tech stocks. The only company that really comes close is the enterprise software company SAP AG (SAP) that is trading at a forward P/E multiple of 17.5.
In terms of the smart phone and tablet industry, Microsoft (MSFT) is trading at a forward P/E multiple of 9.1 with Google (GOOG) trading at a higher forward P/E of 14.03. The PC and laptop maker Dell (DELL) is trading at a forward P/E multiple of 7.5. Additionally, Cisco (CSCO) is trading at a forward P/E multiple of 9.8.
Earnings Estimates
Investors are not happy with analysts who have been well behind the curve when it came to their views on Apple share prices. It is accepted that Wall Street tends to be like that as these analysts have a herd mentality too. They are now busily adjusting downwards all Apple earnings estimates from revenues to net sales. Analysts are predicting lower gross margins as well like what we saw in the recent earnings report.
The good news is that even if Apple is performing at a mediocre level, investors are going to get a good return on their investment with the 2012 ROAA at a meaty 28.54% and the ROAE at a very attractive 42.84%. These numbers are the best relative to other large cap tech stocks, for crying out loud. Additionally, investors already have the $2.65 dividend per share that was paid to them in the last quarter to reward them for holding Apple shares. Moreover, there was a DCF valuation that was done on SA after earnings came out that showed how valuable AAPL still is.
Company
| 3Q12 Units
| 3Q12 Market Share (%)
| 3Q11 Units
| 3Q11 Market Share (%)
|
|---|---|---|---|---|
Samsung
| 97,956.8
| 22.9
| 82,612.2
| 18.7
|
Nokia
| 82,300.6
| 19.2
| 105,353.5
| 23.9
|
Apple
| 23,550.3
| 5.5
| 17,295.3
| 3.9
|
Source: Gartner
As the table above shows, Apple isn't much of a worldwide player yet and it had some recent positive outcomes with the "Samsung Patent Trial" being one. Apple bulls are hoping that still to come market penetration into Asia which is
EPS is expected to continue to increase with the capital inflow that should come from Apple taking away worldwide market share from Samsung and the former smart phone titan Nokia (NOK).
Free Cash Flow
Apple's cash flow has looked better than its reported earnings in the past and there was no change this time with its free cash flow growing 30% to over $21B in the recent quarter. The staggering Apple cash pile of $137B was mainly achieved due to the firm earning $47.4B in free cash flow in 2012. To tell you how extraordinary that is, Business Insider had a piece a few days back about how Amazon.com (AMZN) had generated a measly $5B in its time of existence. The Cupertino, CA based firm has earned three times that amount in the previous quarter.
At the $439.88 stock price that Apple is currently trading at, investors are actually getting a 16.6% free cash flow ROI. In fact, bulls should take note that Apple is trading at its cheapest valuation in a decade. Analysts who follow Apple are quick to point out that the stock price generally bottomed at 10 times gross cash flow. Before its meteoric rise, Apple shares found a bottom in 2011 at 8.5 times cash flow. At the moment, the tech giant is trading at 7.5 times cash flow and bulls sense another once in a lifetime opportunity.
The Takeaway
Apple reported a net profit of $13.06B in its quarterly earnings release last Wednesday. This means that the tech giant actually earned an astounding $1 billion in profits every week in its 13-week quarter that ended in December 2012. This is a highly profitable company that is looking to cash in right now as opposed to the Amazons of the world.
Yet, Apple has to continue to innovate at a rapid pace to stay ahead of the playing field in a highly competitive industry with big name players. The declining demand of Apple products has been the main concern in Wall Street with many feeling that the phenomenal growth story is indeed over. Apple is faced with escalating R&D costs and a short product life cycle that has analysts skeptical about its innovative capacity.
Apple's now slightly diminished market cap of $436B means that Exxon Mobil (XOM) will retain its longstanding No. 1 spot. Anyway, the good thing is that even now it is trading at an extremely high market cap value and the numbers show it is available at a discount for bullish investors.
Investors are being driven by emotion right now after watching Apple shares take a beating over the last few months; falling 35%. Nonetheless, Apple sold 75M mobile devices in a single quarter and anyway you slice the numbers, it shows the stock trading at remarkably low levels for such an admired brand and highly profitable company.
Source: Research on Apple was done through the company's shareholder annual report, the quarterly report and online sources such as Reuters and EDGAR Online.
Disclosure: I am long AAPL. I wrote this article myself, and it expresses my own opinions. I am not receiving compensation for it (other than from HubPages). I have no business relationship with any company whose stock is mentioned in this article.